Reports
Follow-up portrait (2019-2023) - FR only
Initial overview (2019) - FR only
Method
Was this content useful to you?
Thank you for your feedback!
Characterization and monitoring of the quality of the food supply
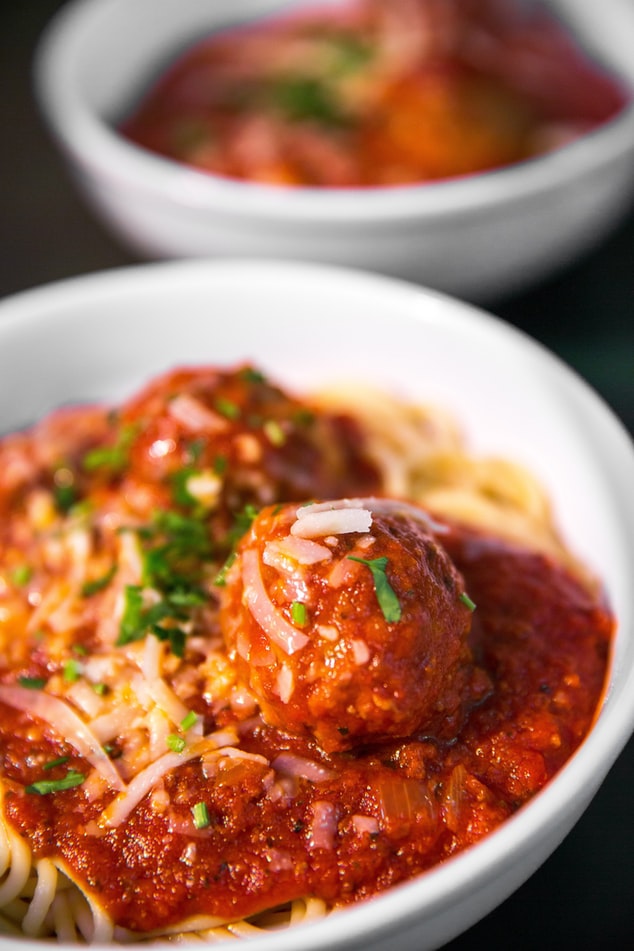
Pasta sauces
Follow-up of the portrait of pasta sauces available in Quebec (2019-2023)
- 348 products were listed for this study
- 428 mg sodium per serving of tomato pasta sauce
- 626 mg sodium per serving of cheese or cream pasta sauce
At a glance
This follow-up shows that, on average, the range of pasta sauces has not changed significantly since 2019. Despite an increase in the proportion of products meeting the Daily Value (DV) thresholds for sodium and saturated fat, the changes noted are not significantly different from 2019. However, specific improvements were noted for certain pasta sauces. This is the case for rosé sauces, which more often meet Health Canada’s voluntary sodium reduction targets. What’s more, when sales are considered, further improvements are observed, notably for modified pasta sauces. This indicates that consumers have purchased these more nutritious products. In addition to saturated fat, sodium remains a nutrient to watch. Although there are more sauces meeting the 15% DV threshold for sodium, still 68% of sauces listed (representing 69% of sales) are above this threshold. Consequently, if no improvement is made by the end of the implementation period (January 1, 2026), 70% of the sauces analyzed in this report will have to display the nutritional symbol indicating high content of at least one nutrient.
To cite this report:
Guillemette D., Pomerleau S., Perron J., Rhéaume CJ. et Provencher V. (2024). Suivi du portrait des sauces pour pâtes disponibles au Québec 2019-2023. Observatoire de la qualité de l’offre alimentaire. 61 pages. [En ligne] observatoire.inaf.ulaval.ca
Reports
Follow-up portrait (2019-2023) - FR only
Initial overview (2019) - FR only
Method
Was this content useful to you?
Thank you for your feedback!