Reports
Follow-up portrait (2018-2023) - FR only
Initial overview (2018-2019)- FR only
Method
Was this content useful to you?
Thank you for your feedback!
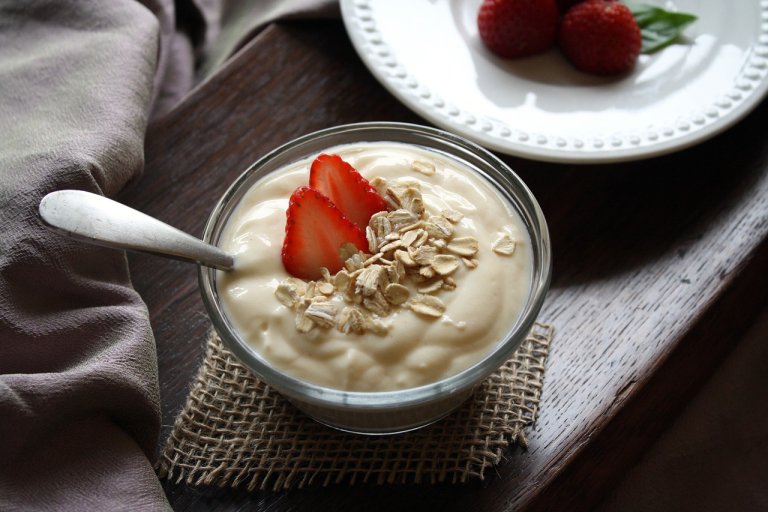
Yogurts and dairy desserts
Portrait of yogurts and dairy desserts available in Quebec (2018-2023)
- 387 products were listed for this study
- 10 g of sugars per individual container of fruit yogurts or dairy desserts
- 12 g of sugars per individual container of flavored yogurts or dairy desserts
At a glance
While very few studies have tracked the nutritional composition of yogurts and dairy desserts and their sales over time, this follow-up shows that few changes have been observed in the nutritional composition of the offer. However, in terms of purchases, some improvements have been noted, meaning that consumers are making better choices, or that major sellers have improved further. Overall, the yogurts and dairy desserts purchased saw a significant drop in carbohydrate content of almost 7%. This seems to be attributable to a reduction in sugar content (although this was not significant). As a result, a greater proportion of products purchased now meet the 15% DV threshold for sugars, and a smaller proportion have the Health Canada nutrition symbol on the front of the packaging.
To cite this report:
Perron J., Guillemette D., Pomerleau S., Rhéaume CJ. et Provencher V. (2024). Suivi du portrait des yogourts et desserts laitiers disponibles au Québec 2018-2023. Observatoire de la qualité de l’offre alimentaire. 62 pages. [En ligne] observatoire.inaf.ulaval.ca
Reports
Follow-up portrait (2018-2023) - FR only
Initial overview (2018-2019)- FR only
Method
Was this content useful to you?
Thank you for your feedback!
See also
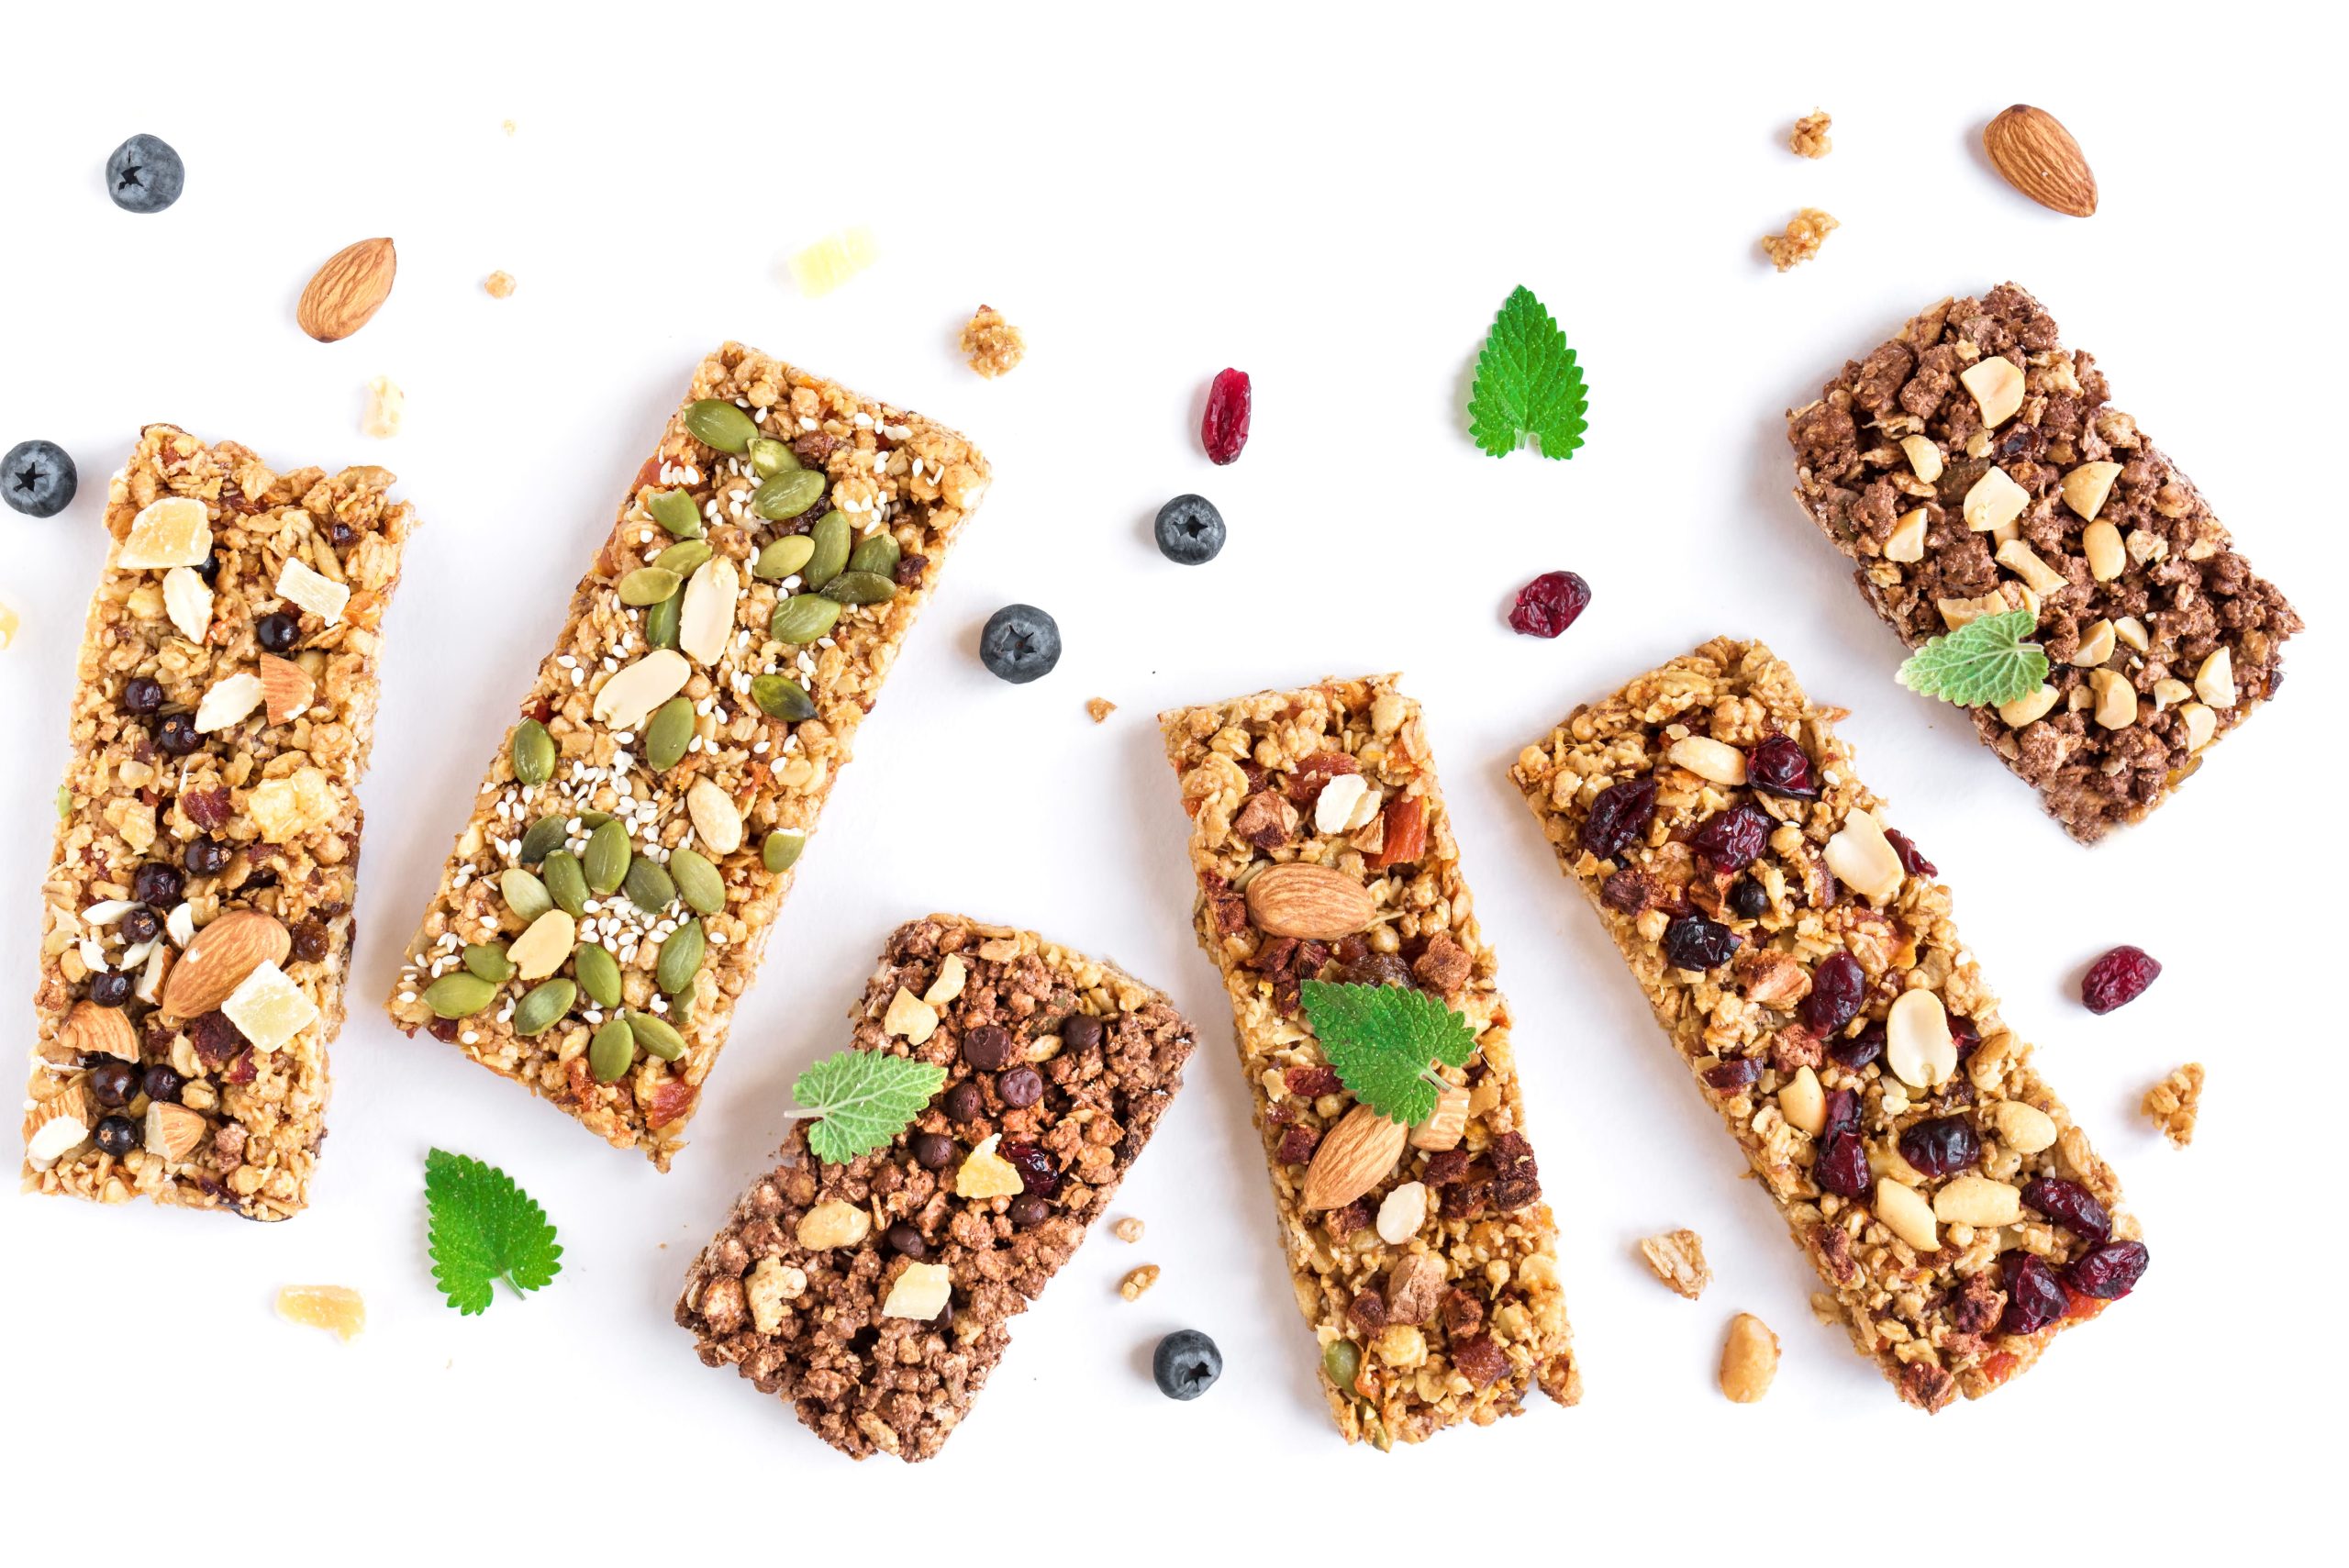
Barres granola, yogourts et desserts laitiers : le sucre sous la loupe
L’Observatoire de la qualité de l’offre alimentaire vous aide à y voir plus clair à l’épicerie dans [...]
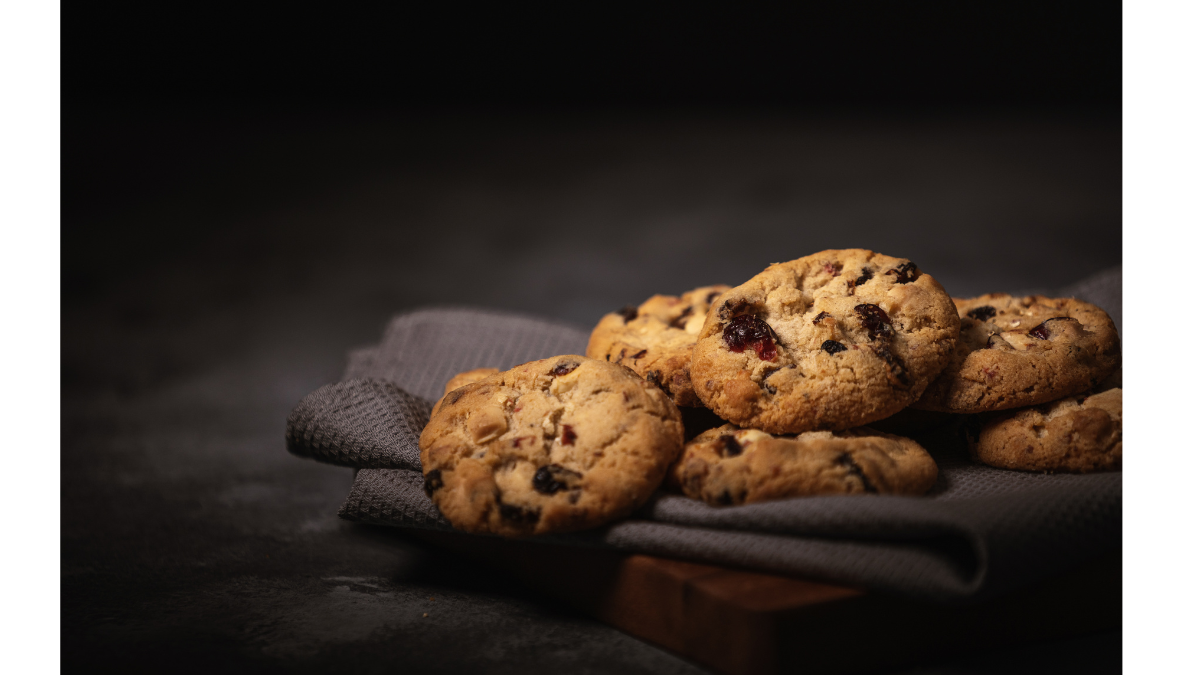
Cookies
Fiche synthèse
Full report
Highlights
Rapport complet
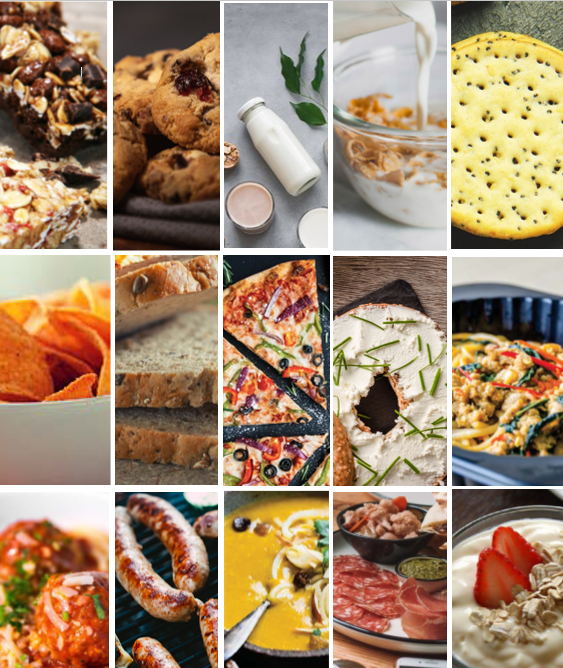
Initial overview of 15 food categories 2016-2022
Full report
Highlights
Scientific article